Nyquist-Shannon Sampling Theorem#
The Nyquist-Shannon Sampling Theorem is a fundamental principle in the field of signal processing, particularly in the context of converting continuous signals to discrete ones. It provides the criteria necessary to ensure that a continuous signal can be accurately reconstructed from its samples without loss of information.
Note
The Nyquist-Shannon Sampling Theorem is named after the Swedish-American engineer Harry Nyquist and the American mathematician Claude Shannon.
Harry Nyquist laid the groundwork by analyzing the conditions for transmitting information over a communication channel, while Claude Shannon extended these ideas in his groundbreaking work on information theory, formalizing the sampling theorem as it is known today. Shannon's contributions were particularly influential in establishing the theoretical foundation for digital signal processing and communication systems.
Theorem Statement
The Nyquist-Shannon Sampling Theorem states:
"If a continuous-time signal contains no frequency components higher than \( f_{\text{max}} \) (the highest frequency present in the signal), it can be completely and accurately reconstructed from its samples, provided that the sampling rate \( f_s \) is greater than twice the highest frequency component in the signal."
Mathematically, this condition is expressed as:
Where:
- \( f_s \) is the sampling rate, or how often the signal is sampled per second.
- \( f_{\text{max}} \) is the highest frequency present in the original signal.
The critical threshold \( 2f_{\text{max}} \) is known as the Nyquist rate.
The full mathematical proof of the Nyquist-Shannon sampling theorem is beyond the scope of this text, but I will provide an intuitive explanation using an example.
Sampling Example#
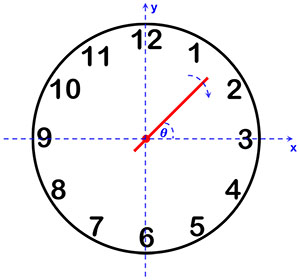
Imagine a room with an analog clock on the wall. This clock has no hour or minute hands, only a second hand that completes one revolution every minute. A camera in the room captures the position of the second hand at equally spaced intervals, sampling its position and sending us the images.

Our objective is to determine the clock hand's rotation frequency (in revolutions per second).
The Ground Truth
As the hand moves clockwise, the angle \( \theta \) between the clock’s second hand and the x-axis continuously decreases. Frequency, defined as the derivative of phase \( \left( \dfrac{d\theta}{dt} \right) \), is negative due to the decreasing angle. Since the hand completes one full revolution in 60 seconds, the actual rotation frequency is:
\[ f = -\frac{1}{60} \text{ Hz} \]

The Experiment
Initially, the camera is configured to sample the position of the clock hand once every 24 hours. After two sampling intervals spanning 24 hours, the data reveals no observable change in the clock hand's position. This occurs because the hand completes 1,440 revolutions during each 24-hour period, recording the same position at each sampling point.
We deduce that the clock hand's frequency is \( \frac{1}{24 \times 3600} \) Hz, representing one revolution in a 24-hour period. However, the clock hand could also complete a single rotation in 12 hours, 8 hours, 6 hours, and so on.
Let \( t_s \) denote the sampling interval and \( T \) the unknown rotation period of the clock hand. Since the clock hand doesn’t change its position during \( t_s \), \( T \) can be any value that divides \( t_s \):
\[ \frac{t_s}{T} = k \]where \( k \) is an integer.
The sampling frequency is \( f_s = \frac{1}{t_s} \), and the clock hand’s rotation frequency is \( f = \frac{1}{T} \). Therefore:
\[ f = f_s \cdot k \]For a sampling frequency of 24 hours:
\[ f = \frac{1}{24 \times 3600} \cdot k \]In fact, there are infinitely many possible rotation frequencies for the clock hand, where \( k \) is any integer in the range:
\[ -\infty < k < \infty \]If \( k = 0 \), the clock hand's rotation frequency equals zero, i.e., the clock hand remains stationary.
Next, we increase the camera’s sampling rate to one sample per hour. After one hour, the clock hand still appears to be in the same position. This observation eliminates possible rotation periods of 24 hours, 12 hours, 6 hours, 4 hours, 3 hours, and 2 hours. The longest possible rotation period is now one hour.
Therefore, the possible rotation frequency of the clock hand is given by:
\[ f = \frac{1}{3600} \cdot k \]We continue increasing the sampling rate until we reach one sample every 30 seconds. Now, we observe a difference between samples! After two samples, the clock hand’s angle changes at a rate of \( \pm\pi \) in 30 seconds:
\[ \omega_0 = \pm 2\pi \text{ rad/min} = \pm \frac{2\pi}{60} \text{ rad/s} \]
The corresponding rotation frequency is:
\[ f_0 = \frac{\omega_0}{2\pi} = \pm \frac{1}{60} \text{ Hz} \]At this point, with the sampling frequency equal to half the signal frequency (\( f_s = \frac{f_0}{2} \)), we can determine the absolute value of the signal frequency. However, two issues remain:
- Direction Ambiguity: We still cannot determine whether the rotation is clockwise or counterclockwise.
- Aliasing (Multiple Possible Frequencies): Other rotation frequencies, such as \( \pm 3 \) revolutions per minute, would produce the same observed result. Similarly, frequencies of \( \pm 5, \pm 7, \pm 9, \dots \) revolutions per minute could match the observation.
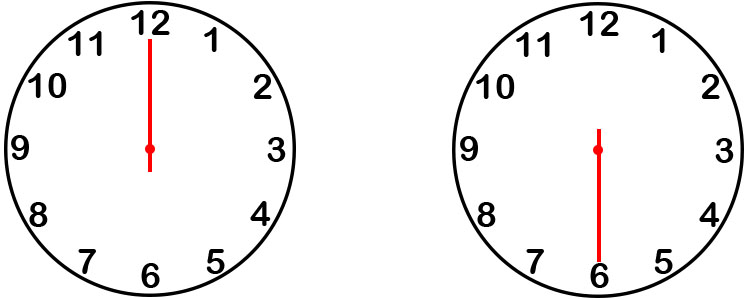
To resolve the first issue, we increase the sampling rate to three samples per minute. After three samples, we observe three distinct positions.

We can now infer the direction of motion - it is clockwise! According to the Nyquist-Shannon sampling theorem, the sampling rate must be greater than half the sampled frequency:
\[ f_s > \frac{f_0}{2} \]In our example, when the sampling frequency was equal to half the sampled frequency, we could not accurately reconstruct the sampled frequency. While \( f_s = \frac{f_0}{2} \) is suitable for many applications, it is not sufficient in this example. We will explore these nuances further when we delve into the sampling topic in more detail.
Aliasing and Its Implications
The second issue, aliasing, persists even as we increase the sampling frequency. Aliasing occurs when different signals become indistinguishable due to the sampling process.
Let’s analyze the aliasing frequencies. At a sampling rate of three samples per minute (\( f_s = \frac{1}{20} \) Hz), the clock hand is sampled at 0s, 20s, and 40s.
The following scenarios can lead to aliasing:
- The hand might be rotating at a frequency of \( -\frac{4}{60} \) Hz (completing \( 1\frac{1}{3} \) revolutions per sample in the clockwise direction).
- Alternatively, it could be rotating at \( -\frac{7}{60} \) Hz (completing \( 2\frac{1}{3} \) revolutions per sample in the clockwise direction), \( -\frac{10}{60} \) Hz (completing \( 3\frac{1}{3} \) revolutions per sample in the clockwise direction), and so on.
There are also possible aliasing frequencies that correspond to counterclockwise rotation:
- The hand might be rotating at a frequency of \( \frac{2}{60} \) Hz (completing \( \frac{2}{3} \) revolutions per sample in the counterclockwise direction).
- Alternatively, it could be rotating at \( \frac{5}{60} \) Hz (completing \( 1\frac{2}{3} \) revolutions per sample in the counterclockwise direction), \( \frac{8}{60} \) Hz (completing \( 2\frac{2}{3} \) revolutions per sample), and so on.
In general, the actual frequency can be any frequency that satisfies:
\[ f = f_0 + m f_s \]where \( m \) is an integer in the range \( 0, \pm 1, \pm 2, \dots, \pm \infty \).
For our example:
\[ f = \frac{1}{60} + m \cdot \frac{3}{60} \]The following table summarizes some of the possible solutions for our example.
| m | Rounds per sample | Rounds per minute | Frequency (Hz) | Direction |
|---|---|---|---|---|
| 0 | \( -\dfrac{1}{3} \) | \( -1 \) | \( -\dfrac{1}{60} \) | clockwise |
| 1 | \( -1\dfrac{1}{3} \) | \( -4 \) | \( -\dfrac{4}{60} \) | clockwise |
| 2 | \( -2\dfrac{1}{3} \) | \( -7 \) | \( -\dfrac{7}{60} \) | clockwise |
| 3 | \( -3\dfrac{1}{3} \) | \( -10 \) | \( -\dfrac{10}{60} \) | clockwise |
| -1 | \( \dfrac{2}{3} \) | \( 2 \) | \( \dfrac{2}{60} \) | counterclockwise |
| -2 | \( 1\dfrac{2}{3} \) | \( 5 \) | \( \dfrac{5}{60} \) | counterclockwise |
| -3 | \( 2\dfrac{2}{3} \) | \( 8 \) | \( \dfrac{8}{60} \) | counterclockwise |
Finally, let’s derive the equation for aliasing frequencies. Aliasing can occur with any sampled periodic signal, and for this derivation, I will use a sine wave as an example.
\[ x(n) = \sin\left(2\pi f_0 n t_s \right) \]Given that sine is a periodic function with a period of \(2\pi\):
\[ \sin(\alpha) = \sin(\alpha + 2\pi l) \]where \(l\) is an integer. We can write:
\[ x(n) = \sin\left(2\pi f_0 n t_s\right) = \sin\left(2\pi f_0 n t_s + 2\pi n m\right) \]where \(n\) is a discrete-time index, and \(m\) is an integer.
Both \(n\) and \(m\) are integers; therefore, \(2\pi m n\) is a multiple of \(2\pi\). Thus:
\[ x(n) = \sin\left(2\pi \left(f_0 n t_s + m n\right)\right) = \sin\left(2\pi \left(f_0 + \frac{m}{t_s}\right) n t_s\right) \] \[ = \sin\left(2\pi \left(f_0 + m f_s\right) n t_s\right) \]Where:
- \( f_0 \) is the lowest possible frequency that matches the observations.
- \( f_s \) is the sampling frequency.
- \( t_s \) is the sampling period.
- \( n \) is a discrete-time index.
- \( m \) is an integer.
The frequency of the form \(f_0 + m f_s\) (where \(m\) is an integer) will alias with frequency \(f_0\).
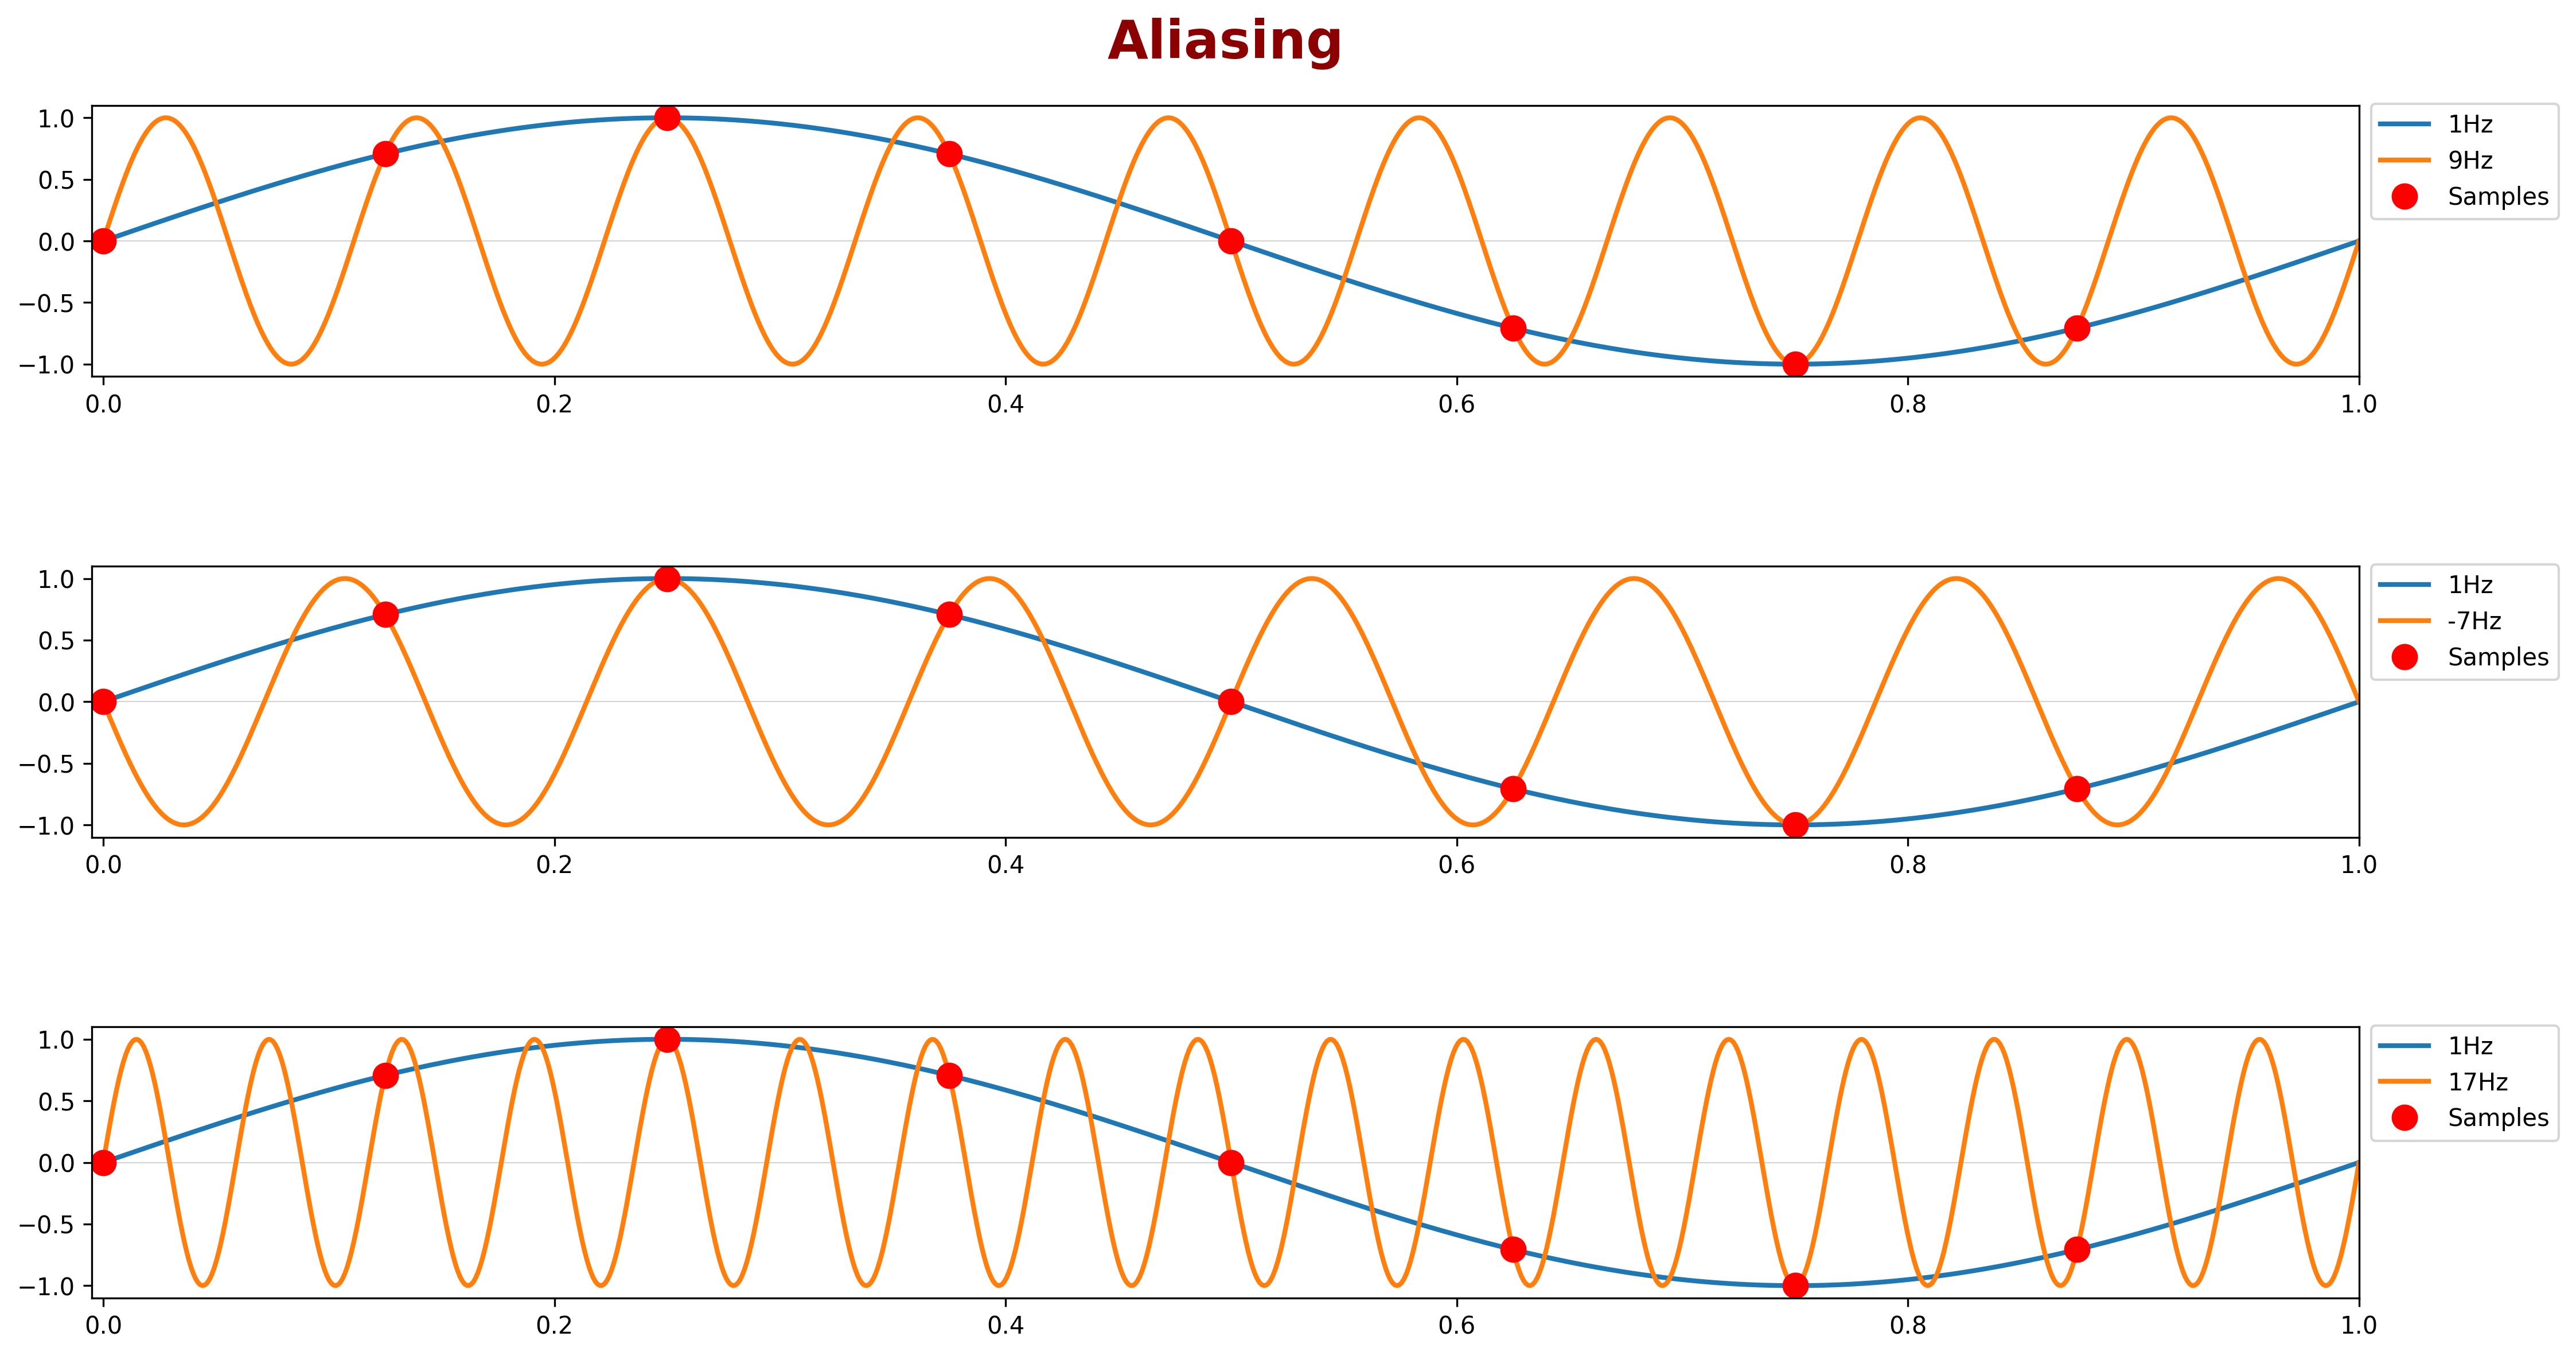
The figure below illustrates a 1Hz signal sampled at a rate of 8 samples per second. A 9Hz signal would produce the same set of samples, as would any signal with a frequency of \(1 + 8m\) Hz, where \(m\) is an integer (e.g., -7Hz, 17Hz, etc.). This phenomenon is demonstrated in the figure.
